by Jamie Sergeant
Contents
Section One: Introduction
- What is a Codec and How Does It Affect Video and Audio Quality?
Section Two: Method
- Exploring Options
- Obtaining Footage.
- Processing Video and Audio
- Creating Files for Delivery
- Deciding the Bitrates
- Packaging for Delivery.
Section Three: Questionnaires and Interview
- Interview Participant and Questionnaire Demographics
- Viewing habits
- Participants Views on Quality – Pre-Exercise
Section Four: Video and Audio Exercises
- Exercise Prediction
- Exercise One – Video
- Video 1: Dark Scene – High to Low
- Video 2: Light Scene – High to Low
- Video 3: Confetti Scene – High to Low
- Exercise Two – Audio.
- Audio 1 – Spoken Word – High to Low
- Audio 2 – Music – High to Low.
- Exercise Three: Video Quality – Low to High.
- Participants Views on Quality – Post Exercise
- Industry insights into quality.
Section 5: Conclusion
Bibliography
Section One: Introduction
Quality is a subjective metric. One person’s ‘good’ quality is another person’s ‘bad’ quality. And the way in which quality is measured is not always obvious. Yet, there is a value in trying to quantify audiences’ experiences while watching media. Television and films are a visual and audial medium, with images and sounds being the interface to the stories filmmakers tell both in the cinema, and increasingly smaller and smaller screens. We are no longer constrained in our media consumption through the controlled space of the cinema.
There is a benchmark in how films are exhibited, with the near ubiquity of the digital projector and the DCP video format. (Dillon, 2022) Some may harken back to the days of film, but may forget the dancing lines, cuts, and bruises of a well warn film print (some may even prefer that aesthetic.) Television has never had the luxury of such control, being placed in our living rooms, battling against reflections, sub-par colours, or the set has motion smoothing turned on.
With digital media being delivered increasingly via packets through the internet, rather than celluloid or broadcast through the airwaves, there is an incentive to keep the file sizes of our favourite films and television to a minimum; to save on bandwidth so as not to slow the connection for the rest of a household, street or even country. This is where video and audio compression is utilised. In its basic form, compression is the act of discarding data in areas in areas which are either not of importance or areas where there is less movement. The key to good compression is that you shouldn’t realise that the image has been compressed. But this isn’t always the case. And with the beating drum of progress, new codecs are more efficient and allow for lower bitrates with less degradation in quality. (What Is a Codec?, 2011)
This research paper strives to answer the question, ‘Do Audiences Care About Video and Audio Quality?’ The research topic is a personal one, many times I have been at a friends or families house, where through different means, the quality of the audio and/or video is sub-par to my eyes and ears. Yet, when asked directly, my subjective experience has been that general audience don’t care, or simply don’t care enough to retrieve a higher quality copy.
Through a mixture of audience exercises, questionnaires, and an interview with an industry professional, the relationship between quality and the audience will be explored, asking how a viewer (or listener) may responds to questions about their viewing habits and their perception of quality, and whether the industry has seen any correlation themselves.
I. What is a Codec and How Does It Affect Video and Audio Quality?
A codec is a way in which digital video can be played by a computing device. Codecs describe a collection of technologies, all focused on compressing video and audio. Different codecs use differing methods to obtain their desired effect, and, as technology becomes better, new codecs are created to take advantage of more superior compression techniques. Some popular codecs include H.264, HEVC (sometimes referred to as H.265 and is the successor to H.264), AV1, and MPEG-2.
Another aspect that is closely related to the codec is a container. A container, as the name suggests, contains the video and audio data. Without a container, a video would be an incomprehensible scramble of ones and zeros. It’s only once the container instructs the decoding device (computer, DVD player, CD) what codec to expect, that the decoding can commence, and a viewer see video or hear audio. The container is easily ascertained by looking at the file extension of a file. Popular containers are, .MP4, .MOV, and .MKV. A container can hold any number of codecs. You might have a H.264 video stream that is practically the same, but be contained in either a .MP4 or a .MKV. The container does not affect video or audio quality. (What Is a Codec?, 2011)
Audio codecs are mostly described by the containers they’re in. An .MP3 is a .MP3 codec inside of a .MP3 container, and it is the same for a .AAC file. In regard to video, the audio stream are contained within the file and could be encoded in an MP3, AAC, or an uncompressed codec. The audio stream and file are opaque to the user. (Audio Codecs Explained for Non-Audiophiles, 2021)
Yet, codec is only one part of the equation when ascertaining video quality; bitrate is the amount of data that is being decoded at one time. The higher the bitrate, the better the quality, but a higher bitrate also wields larger file sizes. As Iain Richardson reveals,
“A 2-hour movie (uncompressed) requires over 194 Gbytes of storage, equivalent to 42 DVDs or 304 CD-ROMs. In order for digital video to become a plausible alternative to its analogue predecessors, (analogue television or VHS videotape), it has been necessary to develop methods of reducing or compressing the prohibitively high bit-rate signal.” (2002, p. 1)
Especially within the streaming landscape, 97GB an hour would be impractical at best, unfeasible at worst. This is where lowering the bit rate by using compression techniques is an invaluable tool for digital video. Netflix, currently the most used paid-for streaming site as of 2022 (Curry, 2022), uses 3GB of data an hour; a 32 times saving in bandwidth. (Summerson, 2018).
Moreover, compressing video and audio will prioritise culling redundant data. With video, compression will often concentrate on details in shadows (the dark areas) and highlights (the light areas) and parts of the image that don’t move as much. The latter example is more computationally expensive but has the advantages of smaller files sizes. Plus, modern micro-processors have hardware acceleration specially designed to decode compressed video efficiently, but any fast processor should handle this task with ease. (What Is a Codec?, 2011) In audio, compression will contrate on sub-bass (the lowest notes that most humans can’t hear) and high notes (which again, humans have trouble hearing) and prioritising the mids, where most vocals, instruments and sound effects will be. (Audio Codecs Explained for Non-Audiophiles, 2021) Compression, when executed correctly, is designed to be invisible.
Section Two: Method.
I. Exploring Options
To test whether audiences respond to audio and visual quality, there was a need to first establish a workflow in which to process and exhibit video files to a general audience. A few options were initially explored, from screenings in theatres, to hosting files on a bespoke, custom-made site. However, it quickly became apparent that the easiest and most effective way to deliver high quality video to an audience is to download it. Streaming the video may seem like the obvious option, but the very nature of scrutinising bitrate and quality, means that streaming had to be discarded. When uploading to a video site like YouTube or Vimeo, the service will reencode the video. If you have a lower bitrate video, it will display the content in a comparable bitrate, but for the higher bitrates, the streaming services would have curtailed the quality, thus voiding the experiment.
II. Obtaining footage.
To achieve the best quality possible for the participants to view, the pre-encoded video and audio files needed to be of the highest quality possible. This meant sourcing video files that were captured straight from a camera, capable of shooting broadcast and film ready media. ‘Method in Motion,’ a Birmingham (UK) based production company, supplied footage which had been shot for a client. The video had been shot on a RED Gemini DSMC2 shooting 4K in using RedRAW (.R3D), in the RED wide Gamut RGB picture profile and using the IPP2 workflow.
The ‘confetti video’ was sourced from the online stock image site Videvo. (Close Up of Friends Celebrating New Years Eve with Confetti Free Stock Video Footage Download Clips, 2022) The scene containing confetti was not a coincidental choice. Confetti is notoriously difficult for video codecs to compress, due to its visual complexity, and would show the shortcoming of compression. (Tom Scott, 2016) The video was originally slow motion and was sped up to become real time.
The music video was obtained from Tom Chimiak, a filmmaker and artist based in the West Midlands, UK. He filmed and edited the video for the band, ‘Diving Station.’ He had shot the video on a Sony FS5, however, as this footage was not for judging video quality, obtaining the original video wasn’t needed, as the audio was the focus. It must be noted that the audio was pre-compressed to 320kbps when obtaining the music video, however, as most video audio is compressed to 320kbps or lower when in stereo (save for Blu-Ray) it was decided that this would be a good starting point.
The spoken audio was recorded by Jamie Sergeant, using a Zoom H5 XLR recorder, connected to a mac and recorded into the app, Garageband. The microphone was a Rode NTG2 and was directly attached to the H5. The script was taken from the Wikipedia article for ‘video’. (‘Video’, 2022) The file was exported as a .WAV (uncompressed) with a floating bitdepth of 24.
III. Processing Video and Audio
The video files needed to be processed for the videos to comply with broadcast and film standards. The RED footage was shot in a wide gamut, which maintains details in the highlights and shadows, but looks “washed out,” with blacks becoming grey. To combat this, the video files were processed in Blackmagic DaVinci Resolve 17, using the ACES workflow. Using the metadata from the camera, the programme brings the contrast ratio and the colour space into a profile that is more suited for film and TV; in this instance, Rec. 709. The video clips were then manipulated further, with the highlights being brought down in the ‘lighter’ clips due to over exposure. Two titles were added to the clips, with a letter, and a credit for the creator. Seven videos (labelled A to G) for the ‘light’ scene, and seven videos (labelled A to G) for the ‘dark’ scene, were exported as .MOV ProRes 422HQ files, for the maximum video fidelity. All audio was discarded.
The confetti video had minimal modifications. It was sped up 400% to make it real time and had two titles added; one to add a letter, the other to give credit. The video was modified slightly by lifting the mids and highlights to add some clarity. Seven videos (A-G) were exported as a .MOV ProRes 422HQ files.
The ‘Diving Station’ music video was split into seven sections with each section at a duration of 5 seconds. Three titles were added to the videos; one to add letters, another to add credits, and the last to note that video quality will stay the same. Each five second chunk was exported separately. Seven videos were exported in total (A-G) and exported as a .MOV ProRes 422HQ file using a Linear PCM audio codec (uncompressed.)
For the dialogue portion of the exercise, it was decided that there needed to be a video component, so the participants easily identify the portion of the video and accurately report it. One title—denoting the letter of the video— was added to a black background. Seven videos were exported (A-G) as .MOV ProRes 422HQ files using a Linear PCM audio codec (Uncompressed.)
IV. Creating Files for Delivery
Once all the high-quality materials were processed, they had to be exported at various quality settings and ensure that they could be watched by the participants. It was decided that each scene should be one video consisting of multiple different videos at the bitrates that were selected. This was so the participant wouldn’t be overwhelmed by the volume of videos files that would have been presented to them—which would have been a total of 56 separate videos.
To compress the videos, it was decided to use the open source x264 encoder. This encoder is used in many different apps, but Handbrake—an open source and free piece of software—was used, which has an implementation of x264, in an easy-to-use GUI. Each video was loaded into Handbrake. The videos all had their encoder preset set to ‘Placebo’ (the highest quality), the profile to ‘high,’ and the encoder level at ‘5.2.’ All videos were set to constant framerate and set to same as source (all videos were coincidently 25fps.) Each video was also set to ‘2-pass encoding.’ Filters and resolution scaling were turned off. These settings were chosen to give the best outcome for the finished videos and maintained that only the ‘average bitrate’ setting influenced the image. The videos were exported in an .MP4 container, with a H.264 codec.
For the audio exercise, the video settings were set to the encoder preset ‘fast,’ profile ‘main’, and level 4.0. The frame rate was set to constant and same as source. ‘2-pass encoding’ was turned on and all scaling and filters were turned off. As video was only for reference it wasn’t as important. The audio codec was set to ‘AAC (CoreAudio),’ with a stereo mixdown, and sample rate set to ‘auto.’ Auto was chosen, so the bitrate would affect the quality of the audio, by also choosing the relevant bit depth the changes in quality would become more apparent to the participant in the final output.
V. Deciding the Bitrates
To ascertain what bitrates would be presented to the participants, there was several real-world considerations that need to be taken. Due to the highest quality 1080p image in the consumer market being obtainable on Blu-Ray, it was decided to emulate the Blu-Ray bitrate, which is in the vicinity of 40mbps (40,000kbps)(Zamanian, 2016). From there, the video quality needed to step down at sensible intervals. One target was to emulate Netflix, as Netflix is the most popular streaming platform. Netflix, due to their adaptive bitrate, can fluctuate and change its Bitrate, but generally it is between 4300 and 5800 kbps for a 23.796 frames per second (fps) file, so it was decided that 5500, would be a good middle point (especially because the source material was 25 fps). (Summerson, 2018) YouTube uses 3.0 – 9.0 Mbps (3000-9000kbps) To give a more varied spread of bitrates, it was decided to take it from the lower values. When reviewing the outputted files, 3500kbps gave the optimal results. (Joe, 2022)
With those three main bitrates decided upon, the bitrates needed to be stepped down in intervals. The last value would be 1000 kbps. Any lower and the video would ‘break up’ with colours becoming ‘streaky’ and large portions of grey being shown, which would not have given the desired outcome for our participants.
The final set of bitrates for video, all shown in KBPS, were decided upon as follows:
- 40,000 (Blu-ray)
- 15,000
- 5500 (Netflix)
- 3500 (YouTube)
- 2500
- 1250
- 1000 (Minimum viable)
Regarding audio, it was decided to use bitrates that are used in audio recording. The standard range of an MP3 (the most popular audio format) is between 320kbps and 96kbps. (Ultimate Guide To Audio Bitrate & Audio Formats – Home DJ Studio, 2022) It was decided to start with the highest quality AAC we could achieve at 320kbps and step down to 24 kbps. The hypothesis is that participants would not be able to acutely hear the differences, so to push the quality to the lowest option would help our participants.
The final set of audio bitrates, all in KBPS, were decided as the following:
- 320
- 256
- 128
- 96
- 64
- 48
- 24
Due to our participants being asked to download the files, file size was a consideration, so a ‘variable bitrate’ was used for both the video and audio compression. Variable bitrate (VBR) does allow the KBPS to fluctuate somewhat due to the complexity of the scene. The higher the bitrate supplied to the encoder, the higher quality the encode, which meant that it was suitable for the experiment. Most streaming websites also use VBR. (Zamanian, 2016)
VI . Packaging for delivery.
Once the files were exported, there had to be a way of managing videos for the participants. Asking the participants to open fifty-six individual files would be untenable, so the videos had to be connected for each scene, with the seven bitrate options contained in each video file. However, to merge these files, the video and audio streams could not be reencoded as this would destroy the selected bitrates. The application ‘Lossless Cut,’ merged the clips without reencoding, and essentially would process the seven individual files in one .MP4 container. Eight files were produced (Video 1 – 6, and Audio 1 – 2) which could then be easily downloaded and played by participants computers.
Section Three: Questionnaire and Interview
I. Interview Participant and Questionnaire Demographics
Distributing the exercise materials was to be part of a larger questionnaire, that would be filled out by participants, who would watch and comment on their views. The questionnaire was distrusted through forums, and online groups to sample from the widest demographic.
An interview was conducted between Jamie Sergeant and Andy Dillon, Head of Technical Operations at Vertigo Releasing. Vertigo Releasing is an all-rights UK Distribution company that specialises in independent film. Andy manages the team oversees all content delivery, from signing the contracts to releasing onto platforms (Streaming sites, Blu-Ray, DVD) and/or cinema release. They also solve any high-level technical queries that might arise during the process.
There were thirty-four participants in the questionnaire, with thirty-three agreeing to the ethics statement. Therefore, thirty-three participants data will be processed, with the data from the participant who didn’t agree being discarded as per the ethics statement.
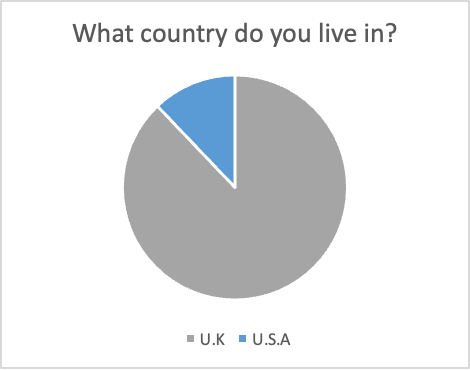
Most of the participants, 29, live in the United Kingdom with 4 participants living in the United States ofAmerica. There are streaming platform differences between the two countries, with some services being exclusive to each region. The UK is a PAL region (broadcast television content being shown in 25fps) and the USA is an NTSC region (broadcast television content is shown in 30fps), however, for the purpose of this project, it does not affect our findings, as the materials are all 25fps, no matter the participants geographical location. (NTSC vs PAL: What are they and which one do I use?, 2014)
| What is your age? | |
| Under 18 | 0 |
| 18-24 | 3 |
| 25-34 | 19 |
| 35-44 | 5 |
| 45-54 | 3 |
| 55-64 | 3 |
| 65-74 | 0 |
| 75+ | 0 |
| Prefer not to say | 0 |
The age range of the participants span between 18-64, with most of the participants in the 25-34 age range. This is consistent with industry trends which shows the 18-34 demographic most embracing the streaming VOD platforms with 44% of the users in this bracket. (‘The UK VoD Market: Current Status and Future Developments’, 2019, p. 5)
Further demographics don’t affect how people perceive the quality of video and audio, and so, due to the data not having any pertinence to this research project, it has been omitted.
II. Viewing Habits
To achieve a better understanding of our participants media consumption habits, several questions were posed to them to ascertain this data. First, they were asked how many streaming platforms they watched.

31 of the 33 participants to answer watch Netflix, which is the biggest paid streaming service with 222 million subscribers worldwide as of 2022. (Alessandrini, 2022) Amazon Prime video had 29 participants say they watched, YouTube another 29, and Disney+ at 27 participants. It is of note that Disney+ is the youngest of the player out of the top four having launched in November 2019 (Disney+ Launches Today—and a New Era of Disney Entertainment Begins, 2019). The brand recognition of the Walt Disney Company is pervasive. AppleTV+ had 8 participants confirm they subscribed.
| 17. How many streaming sites do you watch? | |
| Hulu | 4 |
| BBC iPlayer | 4 |
| All4 | 4 |
| Now TV | 3 |
| ITV HUB | 3 |
| HBO Max | 2 |
| Peacock | 2 |
| Discovery+ | 2 |
| Paramount+ | 1 |
| Arrow Player | 1 |
| Mubi | 1 |
| Shudder | 1 |
| CrunchyRoll | 1 |
| Funimation | 1 |
| Acorn | 1 |
| Britbox | 1 |
| None | 0 |
The other VoD sites are either regional specific or cater to a niche market. Hulu is a US only service and had 4 participants confirm that they watched this service, all of whom stated they lived in the USA. If the questionnaire were to be circulated further to US participants, it is suspected that the number would be higher for Hulu. Paramount+, at the time of the questionnaire being active was a US exclusive but has since been released worldwide. Other streaming site of note include HBO Max, the two anime platforms, CrunchyRoll and Funimation and the traditional UK broadcasters streaming platforms including BBC iPlayer, All4 and ITV hub.
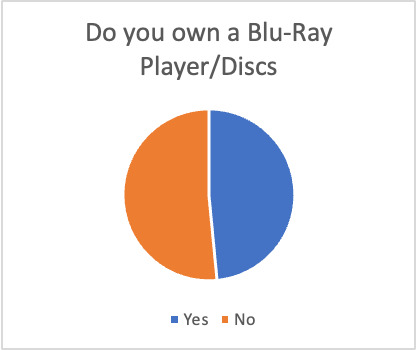
Due to Blu-Ray, being the highest bitrate consumer source of 1080p, it was important to assess how many participants owned a Blu-Ray Player and why they owned said player. 16 participants said they owned a Blu-Ray player, 17 said they did not.
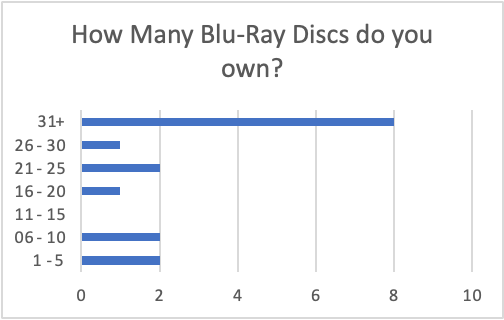
Most participants who owned a Blu-Ray player said they had 31+ Blu-Rays. This shows that if you do own a Blu-Ray player, you’re more likely to own a collection of discs.

The participants were asked why they own their Blu-Rays Player/Discs. The Playstation 4 and 5, as well as the Xbox One and Xbox Series both come with Blu-Ray players included (except for the digital only variants of the consoles). However, this was not the most popular answer with both ‘Care about video and audio quality’ and ‘Like to own physical media’ being selected more.
This goes to prove that there is still a strong want for the video and audio quality, and even more an appetite for owning physical media, rather than moving entirely to downloading/streaming. ‘Need a DVD Player and decided to buy a Blu-Ray player,’ had two selections, showing there is a small subsection that will not use their player to its full potential.
III. Participants Views on Quality – Pre-Exercise
Before the participants ran through the exercises, they were asked on their views on video and audio quality to gather a base line of the participants opinions. They will be then asked the same questions after the exercises to ascertain whether their opinions have been positively or negatively influenced.
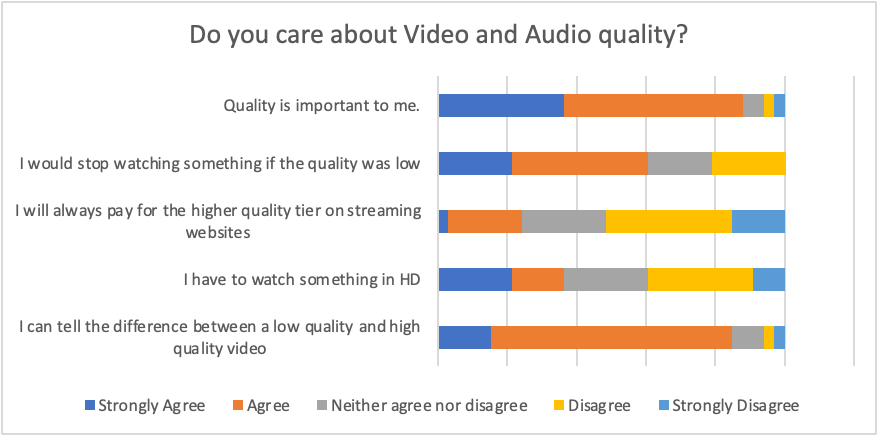
The participants were asked five statements which they had to answer one of five options: Strongly agree, agree, neither agree nor disagree, disagree, and strongly disagree.
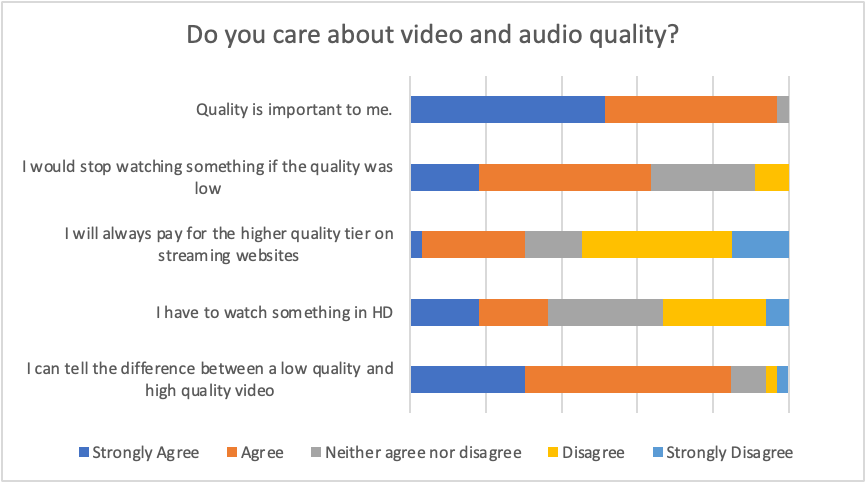
The first statement, ‘Quality is important to me,’ skews to agreement, with 51.50% answering strongly agree and 45.5% Agree. This compared to disagreement, where none of the participants answered disagree or strongly disagree. 3% answered Neither agree nor disagree. Quality is obviously important to most of the participants.
The second statement, ‘I would stop watching something if the quality was low,’ still skews assertive, although more tentatively. Strongly agree has 18.2% and agree has 45.5% of participants. A larger majority picked neither agree nor disagree, 27.3%. And 9.1% answered disagree with no one answering strongly disagree. This suggests that the participants would stop watching media if the quality was low, but a not insignificant percentage would not.
The third statement, ‘I will always pay for the higher quality tier on streaming websites,’ is more definitively negative. 39.4% answered disagree and 15.2% strongly disagree. 15.2% answered neither agree nor disagree, with 27.3% for agree, and only 3% answering strongly agree. This suggests the participants would trade off between price and video quality, with the majority deciding that monetary value is more important.
When asked, ‘I have to watch something in HD,’ the participants were less certain, with the highest percentage of answers being in neither agree nor disagree at 30.3%. Agreement was lower with both strongly agree and agree both receiving 18.2% of the answers. Disagree had 27.30% and 6.1% strongly disagreed. Although overall the agreement of the statement is 36.4% of the answers, the fact that the largest category was not sure, suggests that, for a large proportion of the participants, HD was either not a red line, or that it doesn’t matter to them.
For the statement, ‘I can tell the difference between a low quality and high-quality video,’ participants are confident that they can, in-fact, tell the difference. 30.3% strongly agreed and 54.5% agreed (which is the highest percentage out of any statement.) 9.1% neither agreed nor disagreed, 3% disagreed and 3% strongly disagreed.
Section Four: Video and Audio Exercises
I. Exercise Prediction
During the interview with Andy Dillon, Jamie Sergeant asked for their prediction on whether audiences would notice video or audio quality more.
“I’m going to say video, and the reason why I’m going to say video is because we had error on a film once that was really quite jarring on the audio side. And it was about four months before we had complaints that came back to us, and we realised that it had been delivered wrong and somehow managed to get through QC on the other side and be at the customer side. And when I listened to the error I was like, oh god, how have these people been watching this film like that on this site? But the video looked great.” (Dillon, 2022)
II. Exercise One – Video
To recap, the participants were presented with three videos of different scenes. One dark, one light and the other a confetti scene. Each video is encoded from high quality to low quality with the letters A to G superimposed on them. The bit rates—in KBPS—that will be used in order are:
- 40,000 (Blu-ray)
- 15,000
- 5500 (Netflix)
- 3500 (YouTube)
- 2500
- 1250
- 1000 (Minimum viable)
All the videos are exported at 25fps.
a. Video 1: Dark Scene – High to Low
The participants were asked to open the file labelled ‘Video 1’ and chose which section (A to G, or Don’t Know) best fit their opinion: ‘In the file ‘Video 1’ at what point does the video quality become ‘bad?’’ The scene was ‘darker’ with more of the action in the shadows.
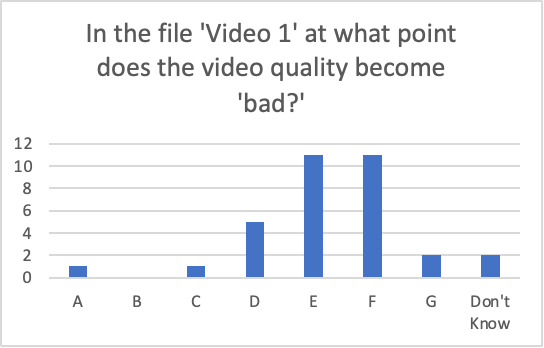
E and F were the options that were chosen most often by the participants with 11 each. This is a lower bitrate than YouTube. D is the next most popular with 5 participants. G has 2 answers, and 2 participants answered don’t know. A and C both had 1 vote each.
The participants were then asked, ‘How obvious was the change in quality at your chosen value in Video 1?’ They had to choose on a scale of 0 to 10, with 0 being ‘not obvious’ and 10 being ‘obvious.’

As you can see, the is a spread of opinions with a spike at value 7. However, as most participants answered between 2 and 6, it would suggest that people were unconfident about their opinion.
b. Video 2: Light Scene – High to Low
The participants were asked to open the file labelled ‘Video 2’ and chose which section (A to G, or Don’t Know) best fit the question: ‘In the file ‘Video 2’ at what point does the video quality become ‘bad?’’ The scene was a ‘lighter’ with more of the action in the mids.
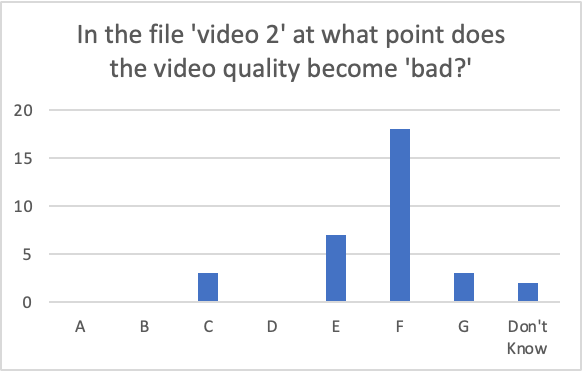
The most popular option, with 18 of the participants answering, was F. This suggests that lighter scenes can be compressed further, with the compression artefacts being mush less obvious at higher bitrates. However, the next largest was E with 7 participants answering, which shows that the images still broke down at the same bitrate as the previous video. Both C and G had 3 answers and don’t know had 2.
The participants were then asked, ‘How obvious was the change in quality at your chosen value in Video 2?’
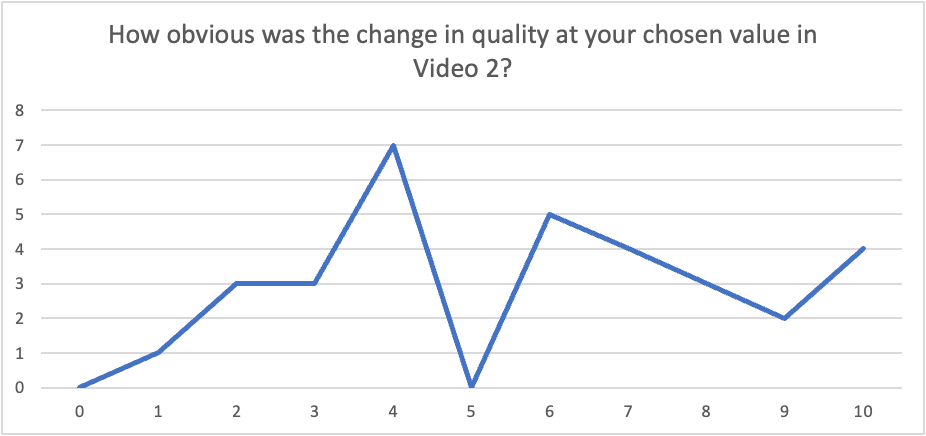
As you can see, the opinions on the second video were less evenly spread, with the highest peak at 4 and the second highest at 6. This shows that the participants were less sure overall than the previous video.
c. Video 3: Confetti Scene – High to Low
The participants were asked to open the file labelled ‘Video 3’ and chose which section (A to G, or Don’t Know) best fit the question: ‘In the file ‘Video 3’ at what point does the video quality become ‘bad?’’ The scene was contained confetti, to test the compressor and show more artefacts.
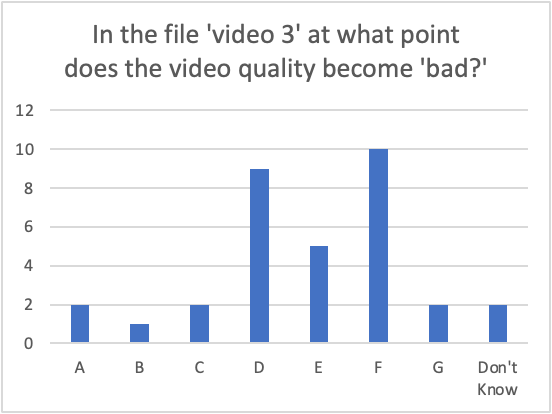
The data from this question is more evenly spread, yet the highest option was F, which reflects the other videos. The second highest value is D with 9 answers. E had 5 votes. A, C, G and Don’t know have 2 votes each with B gaining 1 answer. It is obvious that the compressor had a tougher job, with more people selecting A to C, but most people voted within the normal range of D to F.
The participants were then asked, ‘How obvious was the change in quality at your chosen value in Video 3?’

The graph shows that there were mixed opinions. Between 4 and 10, the numbers fluctuate. This suggests that the participants found it more challenging over all but there were more people answering more confidently. It is more obvious than video 2 and less obvious than video 1, which shows that the darker scene is still easier for people to see ‘bad quality.’
Exercise Two – Audio.
The participants were asked to listen to two examples of audio. Like the previous exercise the participants will be picking at what point they believe the audio is unsatisfactory.
To recap, the participants were presented with two videos containing audio, one spoken word and the other containing music. Each audio track is encoded from high quality to low quality, with the letters A to G superimposed on them. The bit rates—in KBPS—that will be used in order are:
A. 320
B. 256
C. 128
D. 96
E. 64
F. 48
G. 24
a. Audio 1 – Spoken Word – High to Low
The participants were asked to open the file labelled ‘Audio 1’ and chose which section (A to G, or Don’t Know) best fit the question: ‘In the file ‘Audio 1′ at what point does the audio quality become ‘bad?’’ The file contained a ten second spoken word excerpt.

Most of the participants, (22) answered ‘don’t know’ to the question. 3 participants answered D, 4 answered E, 2 participants answered F and 2 answered G. This suggests that the participants heard no difference between the bitrates, although this is unsurprising as spoken word content is traditionally encoded at a lower quality.

When asked how obvious the change in quality was at their chosen value most of the participants answered on the lower end of the scale with 20 participants selecting 0. This corroborates the findings above that the participants found the audio quality indistinguishable between values.
b. Audio 2 – Music – High to Low.
The participants were asked to open the file labelled ‘Audio 2’ and chose which section (A to G, or Don’t Know) best fit the question: ‘In the file ‘Audio 2′ at what point does the audio quality become ‘bad?’’ The file contains a music video where every ten seconds the bitrate decreases.
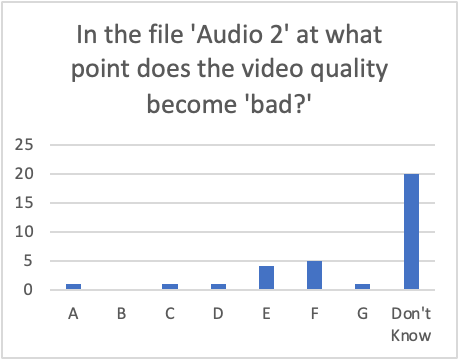
Like the last exercise many of the participants answered, ‘Don’t Know,’ with 20 selections. However, unlike the previous exercise, the rest of the answers are spread across the values. Values A, C, D, and G each had 1 participant answer. E had 4 participants answer, and F had 5 answers. It would suggest that music is easier than spoken word to hear quality differences, although it is still much less definitive than the video exercise.
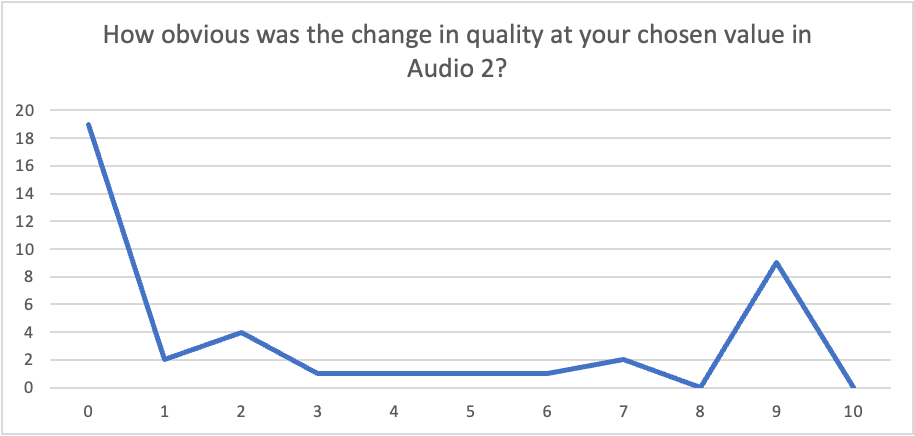
With 19 participants answering 0, it proves that there was a majority unsure about the quality changes. However, 9 participants answered the value of 9, which shows that there was a least a portion of the sample that were confident in their ability to assess the quality, unlike the previous exercise, which corroborates the hypothesis that music is more sensitive to bitrate changes compared to spoken word.
IV. Exercise 3: Video Quality – Low to High.
The next set of exercises were devised to test the choices of the participants from the first video exercise. Each segment of the video is encoded at the same values as the first exercise, but the order has been reversed, with the lowest bitrate being shown first and the highest bitrate being shown last. The bitrates (in KBPS) are now:
- 1000
- 1250
- 2500
- 3500
- 5500
- 15,000
- 40,000
All videos are 25 fps.
The participants were asked to open the file labelled ‘Video 4’, ‘Video 5,’ and ‘Video 6,’ and chose which section (A to G, or Don’t Know) best fit the question: ‘In the file ‘Video 4′ at what point does the video quality become ‘good?’’
The question was deliberately flipped to say good, as the antithesis of bad.

When comparing the results from the first exercise and the third exercise, the consensus was that starting with the lower quality files, makes the earlier files look better. This suggests that, if there is no better-quality source to compare the worse quality to, the worse quality will be perceived as being better sooner. However, the participants who selected ‘don’t know,’ increased in the third exercise. Which again suggests that more people didn’t find any quality difference, due to not having the higher quality version first.
V. Participants Views on Quality – Post Exercise
To better understand whether the views of the participants of the questionnaire changed after participating in the study, they were posed the same questions about video and audio quality that they answered before the exercise, to test whether the act of scrutinising quality make the participants more likely to value video and audio fidelity more?
The participants were asked five statements which they had to answer one of five options: Strongly agree, agree, neither agree nor disagree, disagree, and strongly disagree.
The first statement, ‘Quality is important to me,’ had more negative leaning scores, with 36.4% answering strongly agree (compared to 51.5% pre-exercise) and 51.5% Agree (compared to 45.5% pre-exercise). Disagree and strongly disagree grew from 0% pre-exercise to 3% each. 6% answered neither agree nor disagree. The participants have realised that quality may not be as important to them as it was before.
The second statement ‘I would stop watching something if the quality was low,’ although not as drastic a change as the previous statement still skewed further towards disagree. The amount of people who strongly agreed rose with 21.2% Strongly agreeing (compared to 18.2% in the pre-exercise). However, agree fell to 39.4% of participants (from 45.5% pre-exercise), and disagree rose to 21.2% (compared to 9.1% previously). Less participants answered neither agree nor disagree with 18.4% (compared to 27.3%). Strongly disagree stayed at 0%. This suggests that a small selection of the participants would now stop watching media if it were low quality, but more participants realised they would carry on watching.
The third statement, ‘I will always pay for the higher quality tier on streaming websites,’ stayed consistent with only slight variations in numbers. 36.4% answered disagree (previously 39.4%) and strongly disagree stayed the same with 15.2%. 24.2% of the participants answered neither agree nor disagree (previously 15.2%) which is a slight increase. 21.2% answered agree which is down (from 27.3%) and only 3% answering strongly agree, which stayed the same. This suggests the participants would still trade-off between price and video quality, with the majority deciding that price is more important.
When asked, ‘I have to watch something in HD,’ the participants answered 21.2% strongly agree (previously 18.2%), 15.2% agree (previously 18.2%), 30.3% disagree (previously 27.3%), and 9.1% strongly disagree (previously 6.1%). 24.2% Neither agree nor disagree (previously 30.3%). It would still seem that, for most of the participants the exercise did not change their opinion on HD; it is still not a red line.
After being asked, ‘I can tell the difference between a low quality and high-quality video’, participants became more confident after the exercise, in-fact, 15.2% strongly agreed (previously 30.3%) and 69.7% agreed (compared to 54.5% previously). Neither agreed nor disagreed stayed the same at 9.1%, and so did disagree and strongly disagreed at 3%. Although the participants did get more confident overall, the most confident group fell. Some participants over-estimated their ability and adjusted accordingly.
VI. Industry Insights into Quality.
Quality is not only the purview of audiences, in fact, the industry pays attention to quality. Video and Audio is the product and delivering that product with the highest fidelity is paramount. Even if the audience doesn’t notice. But, as Andy Dillon suggests,
‘… it really depends on the title. So, I think for anything modern, they absolutely care about video quality, to a point. And I think actually a lot of decisions we make around video quality is from a marketing perspective rather than a technical perspective.’ (2022)
Andy suggests that audience members don’t care about video quality after a certain point and will be more persuaded by marketing.
‘…people don’t really respond to 4K particularly well. But if they see UHD and if they see the little HDR banner come up on their TV, they’re very interested and will pay higher price points to access it…’ (Dillon, 2022)
Acronyms are as common in the Film and TV industry as they are in academia. They mostly help with marketing. HD stands for High Definition and usually denotes a video dimension of 1080 pixels by 1920 pixels. 4K, is the successor to HD and has approximately 4000 pixels. There are two types of 4K; UHD (or Ultra High Definition and is the size of home TV sets), and DCI 4K, Digital Cinema Initiatives which is a slightly wider image and used for cinema screens. Other acronyms are HDR or High Dynamic Range, which allows an image to have a higher contrast ratio, meaning the blacks in an image can be darker and the whites in an image can be lighter. There are four types of HDR; Dolby Vision, Dolby Laboratories proprietary solution, HDR 10 and 10+, an open-source alternative to Dolby vision, and HLG, which is a solution for broadcast television. There is also SDR—standard dynamic range—which is the precursor to HDR and is still widely used for non-HDR compatible equipment and media. Dolby Atmos is an object orientated surround sound audio platform, which is a proprietary Dolby Industries product. It essentially allows you to ‘place’ sounds within space, rather than within channels. (‘Video Terms Glossary: Definitions & Acronyms’, 2021)
Andy also pointed out that, ‘…platforms [streaming services], offer higher placement, which is having your film on the front page on release day, if you can hit certain requirements that they’re looking for. HDR really is what they’re looking for.’ (Dillon, 2022) So, currently, rather than concentrating on a certain bitrate—although still an important consideration—distributors are concentrating on what technical milestones they can hit.
Ultimately, as film distributors are businesses, it comes down to, ‘will this extra process generate money?’
“…there is an argument about when quality would stop being something that people would pay for. Currently, it’s around 4K by the looks of it because we have the technology to go higher, and they did. But manufacturers aren’t going with that anymore. And from our perspective, It’s not a thing. You either have HD or you have UHD with HDR. Or it’s nothing. That’s it. That’s the only two options as far as I’m concerned. You have HD, which is good, and a good standard, or you have some kind of fancy UHD with HDR attached to it, which you can market as extra. That’s our consideration basically.” (Dillon, 2022)
Section 5: Conclusion
This research project primary goal was to ascertain whether audiences care about video and audio quality, by judging at what point they find media to be acceptable. The exercises, which saw our participants watch example scenes at varying quality levels and report their opinions showed that, when it comes to video quality, audiences can watch video encoded below even YouTube’s bitrate—which is the lowest bitrate of the streaming services used in this study—and still have a comfortable viewing experience.
All of the participants watched at least one streaming service, which is unsurprising, especially with the majority of the sample in the 18-35 age bracket, where streaming services are most prevalent. (‘The UK VoD Market: Current Status and Future Developments’, 2019) Netflix, Amazon Prime Video, YouTube and Disney+ were the most prevalent streaming platform, and each has standards for the upload quality of their content. YouTube is the only outlier, with some of the content being user generated and so the specifications are more guidelines. (Recommended upload encoding settings – YouTube Help, 2022)
There was a difference between darker scenes and lighter scenes, with the darker scenes being less forgiving to compression, and thus participants would choose values sooner in said videos than in the lighter ones. It was also obvious that a more complex scene, in this case, the confetti scene was also easier for the participants to notice quality changes, with more choosing values before the dark scene.
Yet, most people are watching video content online, which is never going to give you the full fidelity version, as Andy Dyer explains,
“And obviously as you’re saying Netflix definitely don’t show you the full the full file. You know, if you see new UHD with Dolby Vision on Netflix, you’re not seeing the naked file you’re seeing a downstream version, but you can still see that difference.” (2022)
For the average consumer, what they are served is more than enough to meet their needs, and the extra features, like HDR make more of a difference. However, there is a significant number of participants (almost half) who own a Blu-Ray player and do enjoy the highest 1080p image that can be achieved. This shows there is an appetite for higher bitrate video and audio outside of the streaming platforms, although there is an element of accounting for consumers preferring to own physical media which Blu-ray can account for.
As for Andy Dillon’s predictions on whether audiences will notice video or audio quality more, his hypothesis was an accurate one. The participants overwhelmingly had difficulties discerning the differences in audio quality. Most answered ‘don’t know’ to both exercises (although music is less forgiving to compression than spoken word), and even if they did answer they would answer towards the lower end of the spectrum.
It was clear that the order in which the video files were presented also had an impact. When confronted with the best quality clips first, the participants selected lower quality clips as acceptable compared to when the worst quality clips were first. If the participants hadn’t watched the highest bitrate clip first, they found it harder to compare. As an audience consumes content in the real world, it is unlikely that they will see the bitrate change drastically (unless bandwidth becomes scarce and the service must step the bitrate down to maintain smooth playback), and so will accept the quality level to a certain point, which, in this study, is around 2500 – 1000 kbps.
Before the participants participated in the exercise, they were asked their options on quality through five statements, which they needed to answer whether they strongly agree, agree, neither agree nor disagree, disagree, or strongly disagree. They were then asked after completing the exercise. One of the statements ‘quality is important to me,’ demonstrates the trend of the research project. The answers trended further towards disagree after the exercises. Even after considering quality for up to thirty minutes, they concluded that quality wasn’t the most important factor for them.
There is a minimum viable threshold that audiences want their media to be shown to them, however, this is, in terms of the highest quality media that can be obtained on the consumer market, low. But it is clear audiences don’t care about visual fidelity, and certainly not as much about audio fidelity. However, there will always be a place for cinephiles, to whom quality is important. But, for most people, content is king.
Bibliography
Alessandrini, A.S., Sarah (2022) Disney+ and HBO Max show streaming strength against Netflix, CNBC. Available at: https://www.cnbc.com/2022/02/24/netflix-disney-hbo-max-other-streaming-services-subs-arpu-q4-2021.html (Accessed: 4 July 2022).
Audio Codecs Explained for Non-Audiophiles (2021) Audioholics Home Theater, HDTV, Receivers, Speakers, Blu-ray Reviews and News. Available at: https://www.audioholics.com/audio-technologies/codecs (Accessed: 8 July 2022).
Close Up of Friends Celebrating New Years Eve with Confetti Free Stock Video Footage Download Clips(2022) Close Up of Friends Celebrating New Years Eve with Confetti Free Stock Video Footage Download Clips. Available at: https://www.videvo.net/video/close-up-of-friends-celebrating-new-years-eve-with-confetti/1005789/ (Accessed: 8 July 2022).
Curry, D. (2022) Video Streaming App Revenue and Usage Statistics (2022). Available at: https://www.businessofapps.com/data/video-streaming-app-market/ (Accessed: 14 June 2022).
Dillon, A. (2022) ‘Head of Technical Operations at Vertigo Releasing’.
Disney+ Launches Today—and a New Era of Disney Entertainment Begins (2019) The Walt Disney Company. Available at: https://thewaltdisneycompany.com/disney-launches-today-and-a-new-era-of-disney-entertainment-begins/ (Accessed: 4 July 2022).
Joe, H. (2022) How much data does YouTube actually use? — Android Authority. Available at: https://www.androidauthority.com/how-much-data-does-youtube-use-964560/ (Accessed: 26 June 2022).
NTSC vs PAL: What are they and which one do I use? (2014) Corel Discovery Center. Available at: https://learn.corel.com/ntsc-vs-pal-what-are-they-and-which-to-use/ (Accessed: 8 July 2022).
Recommended upload encoding settings – YouTube Help (2022). Available at: https://support.google.com/youtube/answer/1722171?hl=en-GB#zippy=%2Cvideo-codec-h%2Cbitrate (Accessed: 6 June 2022).
Richardson, I.E. (2002) Video Codec Design: Developing Image and Video Compression Systems. John Wiley & Sons.
Summerson, C. (2018) How Much Data Does Netflix Use?, How-To Geek. Available at: https://www.howtogeek.com/338983/how-much-data-does-netflix-use/ (Accessed: 6 June 2022).
‘The UK VoD Market: Current Status and Future Developments’ (2019). Available at: https://www.ofcom.org.uk/__data/assets/pdf_file/0026/149075/ampere-analysis-current-status-future-development.pdf (Accessed: 4 July 2022).
Tom Scott (2016) Why Snow and Confetti Ruin YouTube Video Quality. Available at: https://www.youtube.com/watch?v=r6Rp-uo6HmI (Accessed: 8 July 2022).
Ultimate Guide To Audio Bitrate & Audio Formats – Home DJ Studio (2022) https://homedjstudio.com/. Available at: https://homedjstudio.com/audio-bitrates-formats/ (Accessed: 26 June 2022).
‘Video’ (2022) Wikipedia. Available at: https://en.wikipedia.org/w/index.php?title=Video&oldid=1096736442 (Accessed: 8 July 2022).
‘Video Terms Glossary: Definitions & Acronyms’ (2021) Streaming Video Blog, 18 June. Available at: https://blog.video.ibm.com/streaming-video-tips/video-terms-glossary-definitions-acronyms/ (Accessed: 8 July 2022).
What Is a Codec? (2011) Streaming Media Magazine. Available at: https://www.streamingmedia.com/Articles/ReadArticle.aspx?ArticleID=74487 (Accessed: 8 July 2022).
Zamanian, K. (2016) Everything You Ever Wanted to Know About Bit Rates, The Beat: A Blog by PremiumBeat. Available at: https://www.premiumbeat.com/blog/everything-you-ever-wanted-to-know-about-bit-rates/ (Accessed: 26 June 2022).
